MISO Midcontinent electricity demand today
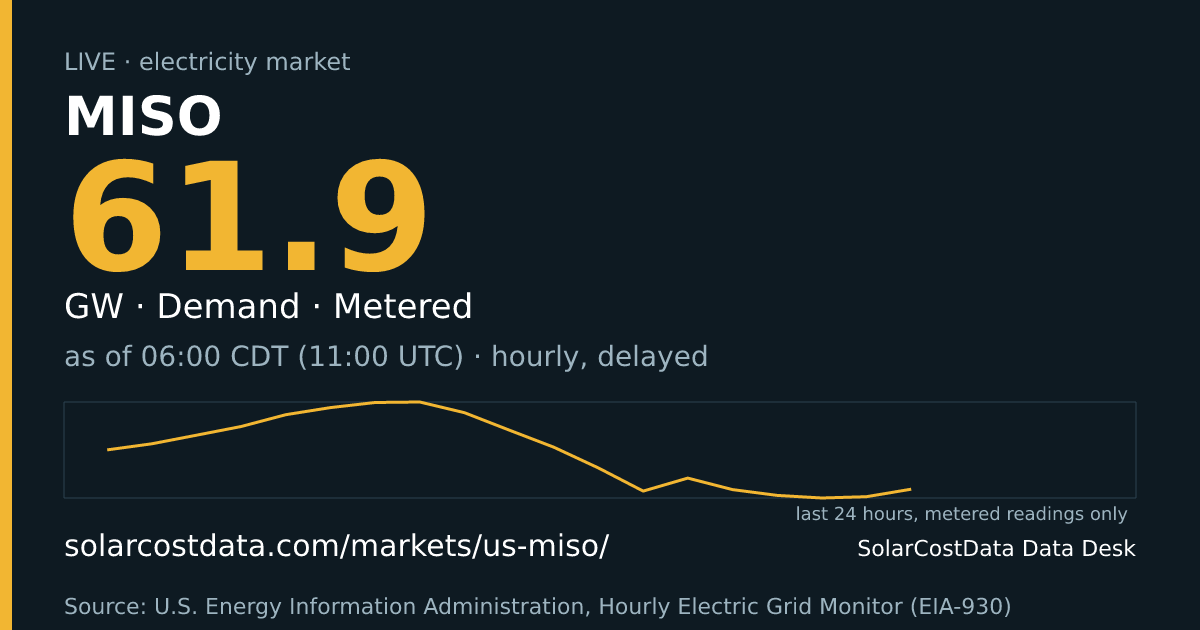
MISO used today
702,580MWhD
Metered to · hourly, delayed
Now
Demand
61910M MWhourly · EIA-930 preliminary · delayed
No price is shown for this market: the EIA-930 feed carries demand and generation, not prices.
Last 24 hours
Min 60891, max 72058, latest 61910 MW. Line breaks mark gaps longer than two reporting intervals.
Baseline building: 2 of 28 days.
Generation mix
This market publishes no generation mix.
About this market
MISO is the long, thin giant of the Midwest. Together with its neighbour SPP, it oversees the grid of the Midwestern United States, a footprint so large that one part can be in a deep freeze while another is mild, so the demand curve you see blends very different weather. MISO’s own published records and operating data are the place to check anything beyond what we show here.
Wind is a defining feature. Wind made up 15% of MISO generation in 2023, and in January 2024 output set a record of almost 26 GW in a single hour. Strong wind can also overload transmission, so operators sometimes curtail it, in step with neighbouring SPP.
For scale, MISO peaked at 121.5 GW on 30 June 2026, the highest in the EIA monitor, though below MISO’s own earlier record. Official MISO prices are published by MISO; we do not show prices on this page.
You see hourly demand, net generation, net interchange and generation by fuel where reported, all from the EIA Hourly Electric Grid Monitor. Values are preliminary, revised later, delayed by an hour or two, and refreshed every three hours. Not for trading or operational decisions.
Source
Source
US EIA · licence · Source: U.S. Energy Information Administration, Hourly Electric Grid Monitor (EIA-930) · fetched ·
Source: U.S. Energy Information Administration, Hourly Electric Grid Monitor (EIA-930). Values are preliminary hourly averages (MWh per hour, shown as MW), published about one to two hours after the hour and refreshed every few hours; they can be revised.
Each value is shown as of the end of the hour it covers. If the feed is silent for more than 8 hours the figure is marked paused with its last value; nothing is estimated.
Facts
- The Midwestern United States is the area overseen by the MISO and SPP balancing authorities (EIA).
- MISO's record demand is 127.1 GW, set on July 20, 2011 (EIA, citing MISO). Source: EIA
- MISO peaked at 121.5 GW on 30 June 2026, the highest in the EIA monitor, below the 127.1 GW record of 20 July 2011 (EIA). Source: EIA
- In 2023, wind generation made up 15% of MISO's total generation and 36% of SPP's (EIA). Source: EIA
- Wind in MISO set a record of almost 26 GW within one hour in January 2024 (EIA). Source: EIA
- Average hourly wind curtailment in MISO rose from 242 MW in 2019 to 508 MW in 2023 (EIA). Source: EIA
- MISO and SPP are joined by more than 6,000 MW of interties (EIA). Source: EIA
Other markets
Demand in other markets
- Great Britain: 25140M MW
- Denmark: 5954D MW
- NEM New South Wales: 6547M MW
- NEM Queensland: 5836M MW
- NEM Victoria: 4530M MW
- NEM South Australia: 1245M MW
- NEM Tasmania: 878M MW
- Taiwan: 26238M MW
- ERCOT (Texas): 44674M MWhourly · EIA-930 preliminary · delayed
- PJM Interconnection: 78578M MWhourly · EIA-930 preliminary · delayed
- ISO New England: 11022M MWhourly · EIA-930 preliminary · delayed
- Southwest Power Pool (SPP): 26473M MWhourly · EIA-930 preliminary · delayed
Cite this
SolarCostData Data Desk (2026). MISO electricity data, solarcostdata.com/markets/us-miso/, accessed 2026-10-25. Source data: Source: U.S. Energy Information Administration, Hourly Electric Grid Monitor (EIA-930).
Download last 24 h: data.csv · data.json (CC BY 4.0 (our figures); source data: Source: U.S. Energy Information Administration, Hourly Electric Grid Monitor (EIA-930))
Not for trading or operational decisions. Provisional data.