ERCOT Texas electricity demand today
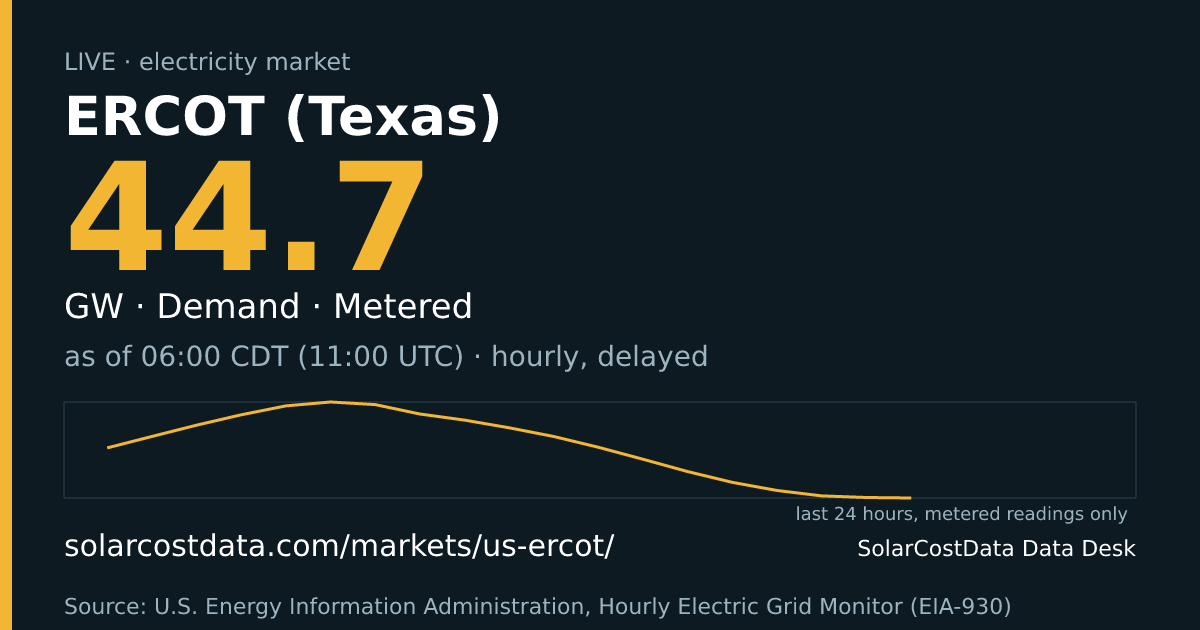
ERCOT (Texas) used today
555,159MWhD
Metered to · hourly, delayed
Now
Demand
44674M MWhourly · EIA-930 preliminary · delayed
No price is shown for this market: the EIA-930 feed carries demand and generation, not prices.
Last 24 hours
Min 44674, max 62094, latest 44674 MW. Line breaks mark gaps longer than two reporting intervals.
Baseline building: 2 of 28 days.
Generation mix
This market publishes no generation mix.
About this market
ERCOT runs the grid for most of Texas, not all of it: it serves most of the state’s electricity customers. ERCOT is unusual because the balancing authority, the interconnection and the regional transmission organization are all one entity, which makes it the clearest example in the country of a grid that mostly has to balance itself. Little power can be swapped with neighbours when a heat wave or a calm evening strikes, so what the weather does to demand and to wind and solar output shows up directly in the curves above.
Texas also has a different market design from its eastern neighbours. ERCOT has no centralized capacity market; generators earn their revenue from the energy market alone, which is why scarcity events draw so much attention. Official ERCOT prices are published by ERCOT. We do not show prices on this page.
Demand keeps setting records. Hourly load reached 91.1 GW on 22 July 2026, and natural gas and solar supplied most of it. Evening hours, when solar fades but air conditioning does not, are the ones to watch.
Here you see hourly demand, net generation, net interchange and generation by fuel where reported. All of it comes from the EIA Hourly Electric Grid Monitor: preliminary, revised later, and delayed by an hour or two. We refresh every three hours. Not for trading or operational decisions.
Source
Source
US EIA · licence · Source: U.S. Energy Information Administration, Hourly Electric Grid Monitor (EIA-930) · fetched ·
Source: U.S. Energy Information Administration, Hourly Electric Grid Monitor (EIA-930). Values are preliminary hourly averages (MWh per hour, shown as MW), published about one to two hours after the hour and refreshed every few hours; they can be revised.
Each value is shown as of the end of the hour it covers. If the feed is silent for more than 8 hours the figure is marked paused with its last value; nothing is estimated.
Facts
- ERCOT is the regional transmission organization serving most of Texas (EIA). Source: EIA
- At ERCOT, the balancing authority, interconnection, and regional transmission organization are all the same entity (EIA). Source: EIA
- Record hourly load was 91.1 GW on 22 July 2026, 6% above the previous peak of 85.5 GW set on 10 August 2023 (EIA). Source: EIA
- At the July 2026 peak, natural gas supplied 48% and solar 32% of generation, according to data reported to EIA. Source: EIA
- The record peak occurred at 6:00 p.m. CT during a heat wave (EIA). Source: EIA
- ERCOT does not have a centralized capacity market (EIA). Source: EIA
Other markets
Demand in other markets
- Great Britain: 25140M MW
- Denmark: 5954D MW
- NEM New South Wales: 6547M MW
- NEM Queensland: 5836M MW
- NEM Victoria: 4530M MW
- NEM South Australia: 1245M MW
- NEM Tasmania: 878M MW
- Taiwan: 26238M MW
- PJM Interconnection: 78578M MWhourly · EIA-930 preliminary · delayed
- MISO: 61910M MWhourly · EIA-930 preliminary · delayed
- ISO New England: 11022M MWhourly · EIA-930 preliminary · delayed
- Southwest Power Pool (SPP): 26473M MWhourly · EIA-930 preliminary · delayed
Cite this
SolarCostData Data Desk (2026). ERCOT (Texas) electricity data, solarcostdata.com/markets/us-ercot/, accessed 2026-10-25. Source data: Source: U.S. Energy Information Administration, Hourly Electric Grid Monitor (EIA-930).
Download last 24 h: data.csv · data.json (CC BY 4.0 (our figures); source data: Source: U.S. Energy Information Administration, Hourly Electric Grid Monitor (EIA-930))
Not for trading or operational decisions. Provisional data.