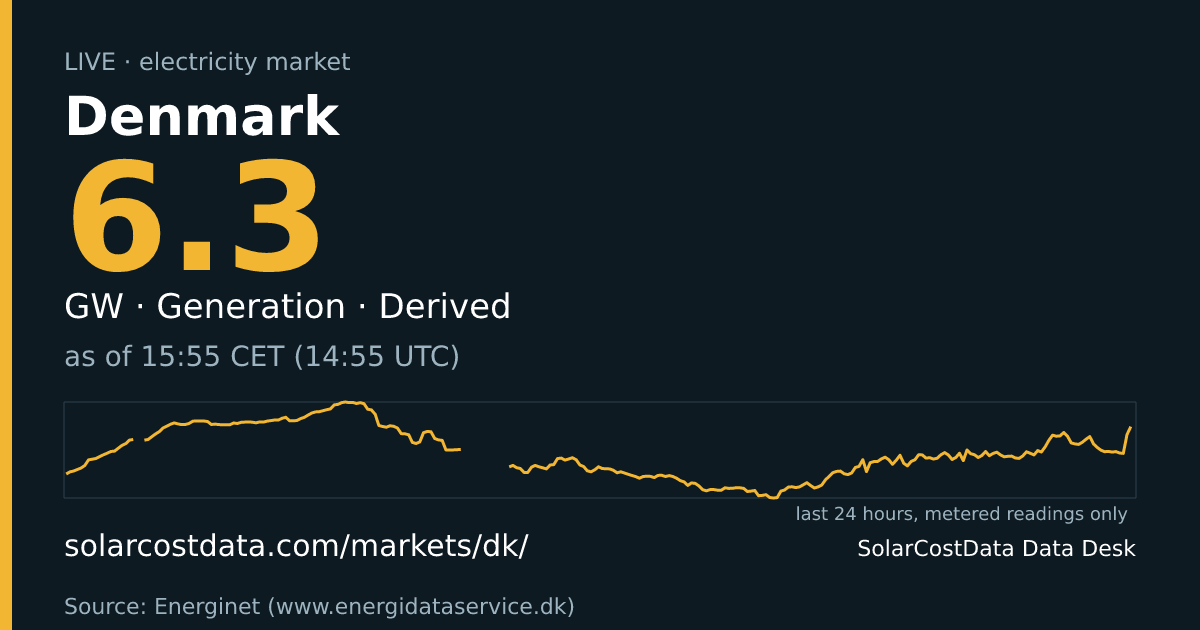
Denmark electricity generation now
Denmark demand now
6.0GWD
· daily count starts 00:00 UTC · partial day 0 %
Now
Generation (total)
6797D MW
Renewable share
95.0D %
This feed publishes no price and no demand.
Last 24 hours
Min 87.4, max 96.3, latest 95.0 %. Line breaks mark gaps longer than two reporting intervals.
Baseline building: 1 of 28 days.
Generation mix
| Source | Output | Share of generation |
|---|---|---|
| Wind | 6350M MW | 93.4D % |
| Other | 341M MW | 5.0D % |
| Solar | 106M MW | 1.6D % |
| Imports | -842M MW | – |
CO2 not shown: thermal output is not split by fuel.
Solar reports a small night baseline (~20-40 MW); shown as metered under the night tolerance (max 50 MW, 2% of capacity).
Thermal production is not split by fuel and is shown as other.
About this market
This page shows electricity generation for Denmark as a whole. It is a national total: we take the five-minute real-time production data from Energinet’s Energi Data Service and add the western zone (DK1) and the eastern zone (DK2) together. We therefore cannot say how much of the wind or solar was produced on either side of the Great Belt. Prices, by contrast, are set per bidding zone and appear on the two zone pages, not here.
Denmark’s fleet is dominated by wind, onshore and offshore, with a growing solar share. The feed does not break thermal production down by fuel, so coal, gas, biomass and waste combustion are shown together as other. An import line is also included, taken from Energinet’s right-now exchange figure; we treat a positive value as import, but the source does not document its sign convention, so that reading is our inference.
Solar reports a small baseline of a few tens of megawatts overnight. Under our quality rule for night-time solar, which allows a small tolerance above zero, this is kept and labelled as metered rather than removed.
What moves the numbers: wind speed above all, then daylight, then how much neighbouring countries want to buy or sell. Denmark can swing between exporting heavily and importing within a day.
Limitations: the totals are provisional, the renewable share is derived from the categories we can see, and the ‘other’ group hides real differences in fuel.
Source
Source
Energi Data Service (DK) · Source: Energinet (www.energidataservice.dk) · fetched ·
Solar reports a small night baseline (~20-40 MW); shown as metered under the night tolerance (max 50 MW, 2% of capacity).
Thermal production is not split by fuel and is shown as other.
CO2 factors: IPCC AR5 WGIII Annex III lifecycle medians — table v1, 2026-10-23.
Facts
- Operator and publisher: Energinet, via Energi Data Service (CC BY 4.0). Source: Energi Data Service terms
- Generation is the ElectricityProdex5MinRealtime dataset, summed over DK1 and DK2, with a five-minute step stamped at the interval start (Minutes5UTC).
- Thermal production is not split by fuel in the feed and is displayed as 'other'.
- The exchange line comes from PowerSystemRightNow (Exchange_Sum); positive meaning import is inferred, not documented.
- Solar shows a small night-time baseline, which our quality rule keeps instead of discarding.
- Local time is Europe/Copenhagen (CET/CEST); stored timestamps are UTC.
- Denmark is split into two bidding zones for prices; this page has no price.
Other markets
Renewable share in other markets
- Great Britain: 59.7D %
- Taiwan: 12.9D %
Cite this
Not for trading or operational decisions. Provisional data.