Queensland electricity price today
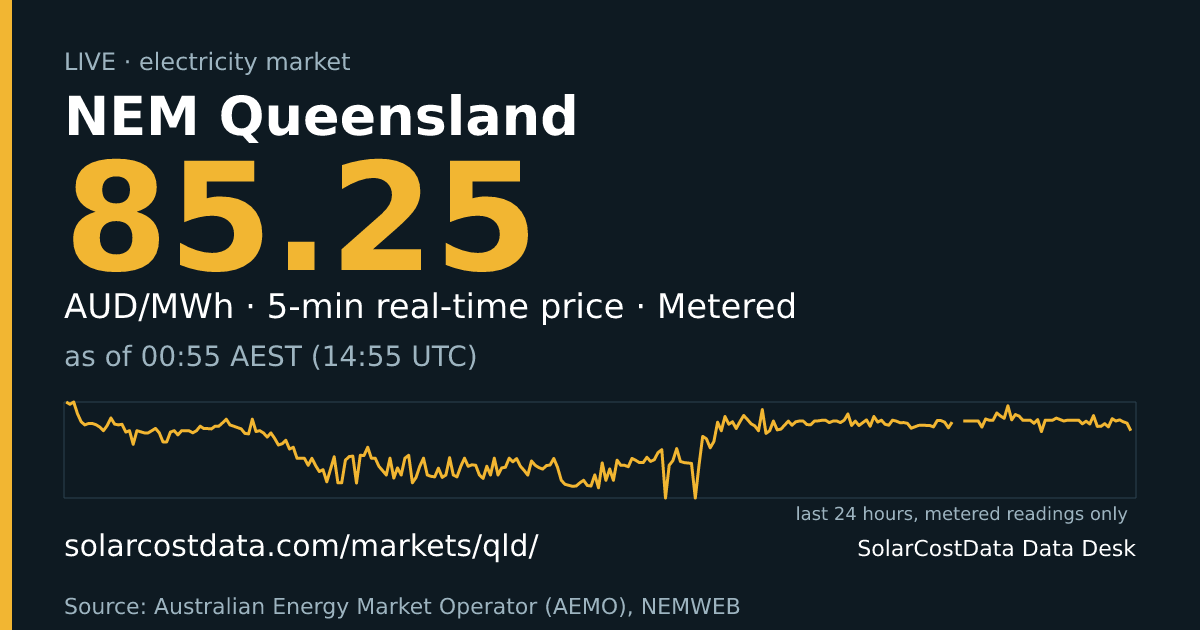
NEM Queensland used today
96,556MWhD
Metered to · ticking at the last metered rate
5-min real-time price 91.28M AUD/MWh · RT5
Now
5-min real-time price
91.28M AUD/MWh
RT5 ·
Demand
5836M MW
Last 24 hours
Min 29.84, max 105.73, latest 91.28 AUD/MWh. Line breaks mark gaps longer than two reporting intervals.
Baseline building: 1 of 28 days.
Min 5024, max 7579, latest 5836 MW. Line breaks mark gaps longer than two reporting intervals.
Baseline building: 1 of 28 days.
Generation mix
This market publishes no generation mix.
About this market
Queensland is the QLD1 region of the National Electricity Market and the northern end of the eastern grid. The numbers on this page are AEMO’s five-minute regional spot price and regional demand, taken from its public dispatch files. Queensland’s local standard time matches the NEM’s fixed clock, and the state government has said reform to its time zone is not currently under consideration, so local time and market time agree here, unlike in states that move their clocks in summer.
The state’s story is the daily swing between midday solar and the evening peak. Rooftop solar output is behind the meter, so strong midday sun pulls grid demand down, often pushing the regional price low around noon, while the evening peak after sunset is where scarcity shows up. Heat waves lift air-conditioning load, and an outage at one large generating unit can move prices more than in a region with many small plants.
Rooftop output is behind the meter, so the demand figure we show is best read as the load the grid has to serve rather than total consumption. That is a limit on how to read the line. We show no generation mix for Queensland; AEMO’s registration list is not part of our feed yet.
All prices are five-minute dispatch prices in Australian dollars.
Source
Source
AEMO (AU) · licence · Source: Australian Energy Market Operator (AEMO), NEMWEB · fetched ·
Fuel mix not collected until AEMO's own Registration and Exemption List is available (Cowork 2026-10-23).
Facts
- QLD1 is the NEM region covering Queensland, the northernmost mainland region of the market.
- Queensland's local standard time is AEST (UTC+10), the same as NEM market time, and the state government has said time-zone reform is not currently under consideration. Source: Bureau of Meteorology Source: Queensland Government
- Spot prices are five-minute dispatch prices; the file timestamp marks the interval end, and we store the interval start.
- The market price cap for 2026-27 is A$23,200/MWh. Source: AEMC
- Demand is AEMO's REGIONSUM.TOTALDEMAND field, which differs slightly from the figure on AEMO's public dashboard.
- Five-minute settlement has applied since 1 October 2021. Source: AEMC
- Currency: Australian dollars (AUD).
Other markets
5-min real-time price in other markets
- NEM New South Wales: 102.39M AUD/MWh
- NEM Victoria: 94.32M AUD/MWh
- NEM South Australia: 103.80M AUD/MWh
- NEM Tasmania: 97.52M AUD/MWh
Demand in other markets
- Great Britain: 25140M MW
- Denmark: 5954D MW
- NEM New South Wales: 6547M MW
- NEM Victoria: 4530M MW
- NEM South Australia: 1245M MW
- NEM Tasmania: 878M MW
- Taiwan: 26238M MW
- ERCOT (Texas): 44674M MWhourly · EIA-930 preliminary · delayed
- PJM Interconnection: 78578M MWhourly · EIA-930 preliminary · delayed
- MISO: 61910M MWhourly · EIA-930 preliminary · delayed
- ISO New England: 11022M MWhourly · EIA-930 preliminary · delayed
- Southwest Power Pool (SPP): 26473M MWhourly · EIA-930 preliminary · delayed
Cite this
SolarCostData Data Desk (2026). NEM Queensland electricity data, solarcostdata.com/markets/qld/, accessed 2026-10-25. Source data: Source: Australian Energy Market Operator (AEMO), NEMWEB.
Download last 24 h: data.csv · data.json (CC BY 4.0 (our figures); source data: Source: Australian Energy Market Operator (AEMO), NEMWEB)
Not for trading or operational decisions. Provisional data.