Negative electricity prices
No market below zero right now
03:45:00D
Last negative: Great Britain 2026-10-25 09:30 UTC ·
Negative hours since 2026-10-21 12.6 hD
Longest run 2:30 hD Great Britain
Price series 8D Hours are counted per price series, so a market with two price types counts twice. A run is an unbroken sequence of negative intervals; a missing interval ends it. Each interval adds its own length (15 min = 0.25 h).
| Market | Now | Last negative | This month Longest run: the longest unbroken run of negative intervals in our data window. Year to date: negative hours since 1 January in the market's local time; every total covers the data window that starts on the date of first data. Median and lowest depth are taken over year-to-date negative intervals. Floor status: the count of intervals within 1% of the floor appears only where the floor is a verified statutory limit. Days since: whole days since the last negative interval ended. A streak is an unbroken run of negative intervals ending now. Every negative interval adds its own length: a 15-minute day-ahead interval counts 0.25 h, a 5-minute real-time interval 1/12 h and a 30-minute settlement period 0.5 h. Great Britain (IMB30): longest 2:30 h, year to date 3.50 h in 7 intervals, median -15.00, lowest -16.27 GBP/MWh, no statutory floor, 0 days since last negative. Denmark DK1 (West) (DA15): longest 1:15 h, year to date 1.25 h in 5 intervals, median -0.07, lowest -0.07 DKK/MWh, floor not verified, 0 days since last negative. Denmark DK2 (East) (DA15): no negative run, year to date 0.00 h in 0 intervals, floor not verified. NEM New South Wales (RT5): no negative run, year to date 0.00 h in 0 intervals, 0 within 1% of the -1000 floor. NEM Queensland (RT5): no negative run, year to date 0.00 h in 0 intervals, 0 within 1% of the -1000 floor. NEM Victoria (RT5): no negative run, year to date 0.00 h in 0 intervals, 0 within 1% of the -1000 floor. NEM South Australia (RT5): longest 2:20 h, year to date 7.83 h in 94 intervals, median -7.01, lowest -29.78 AUD/MWh, 0 within 1% of the -1000 floor, 0 days since last negative. NEM Tasmania (RT5): no negative run, year to date 0.00 h in 0 intervals, 0 within 1% of the -1000 floor. |
|---|---|---|---|
| Great Britain IMB30 | 228.00M GBP | 2026-10-25 09:30 UTC | 3.5D h |
| Denmark DK1 (West) DA15 | 4.86M DKK | 2026-10-25 03:45 UTC | 1.2D h |
| Denmark DK2 (East) DA15 | 29.90M DKK | – | 0.0D h |
| NEM New South Wales RT5 | 97.63M AUD | – | 0.0D h |
| NEM Queensland RT5 | 88.82M AUD | – | 0.0D h |
| NEM Victoria RT5 | 93.81M AUD | – | 0.0D h |
| NEM South Australia RT5 | 101.48M AUD | 2026-10-25 07:10 UTC | 7.8D h |
| NEM Tasmania RT5 | 98.18M AUD | – | 0.0D h |
Sources & licences
Data: Source: Australian Energy Market Operator (AEMO), NEMWEB | Contains BMRS data © Elexon Limited copyright and database right 2026 | Source: Energinet (www.energidataservice.dk). source licence source licence Derived numbers and charts: CC BY 4.0, SolarCostData Data Desk (licence). Source data keeps its own licence.
Heat maps, last 30 days
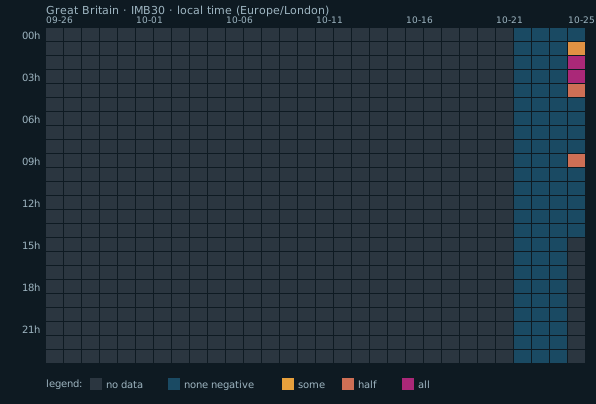
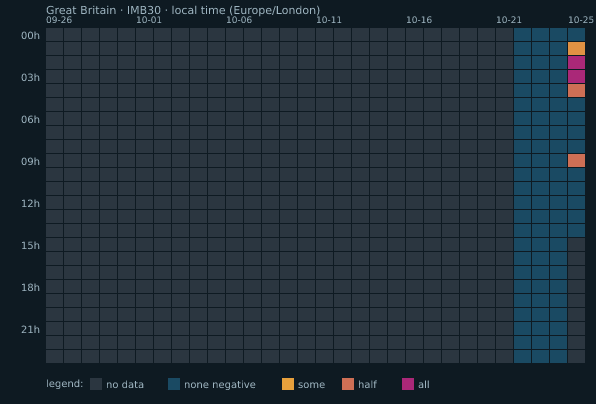
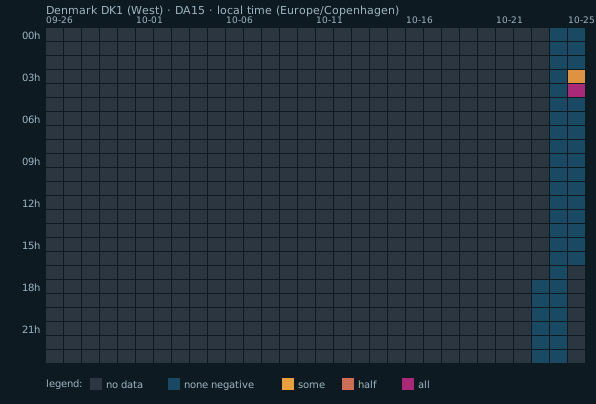
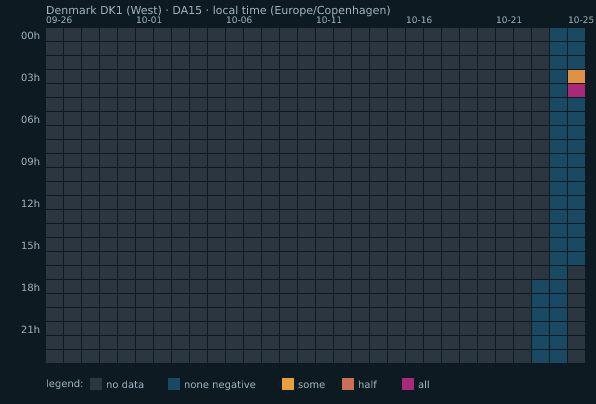
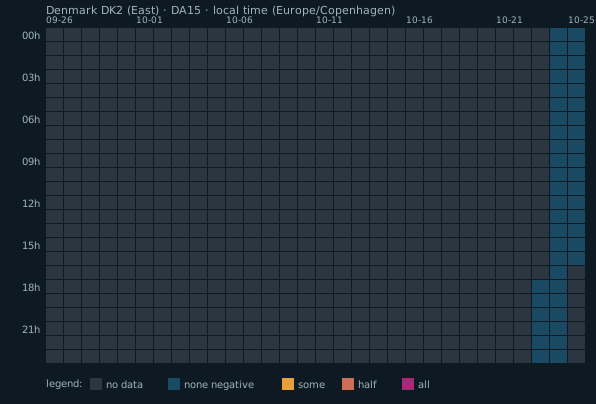
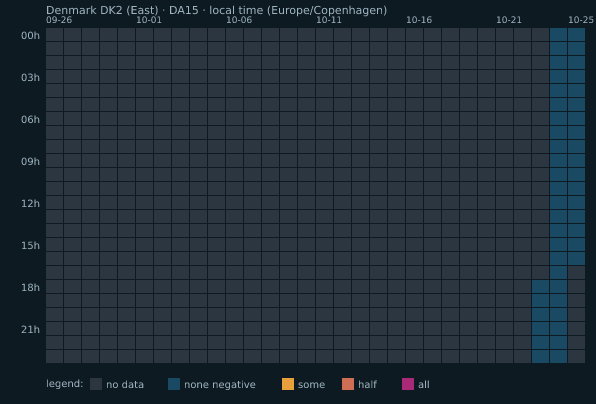
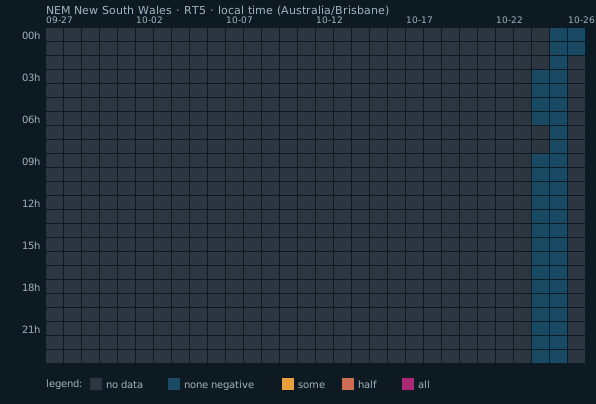
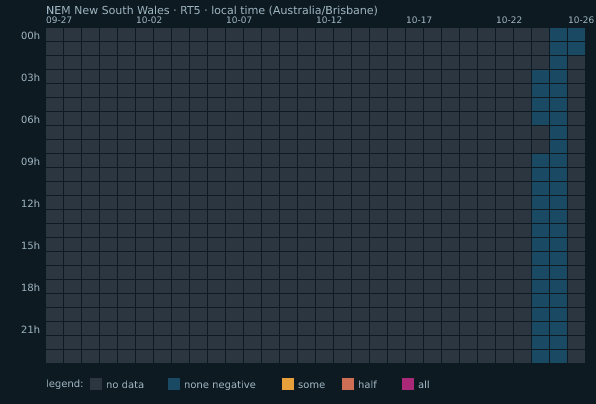
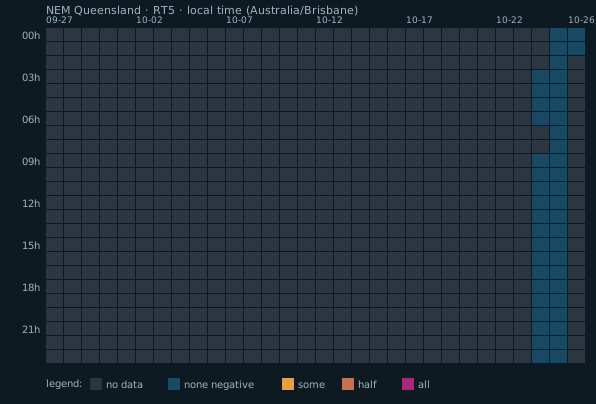
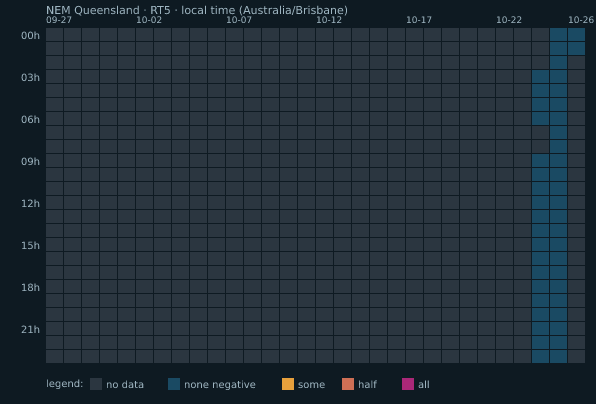
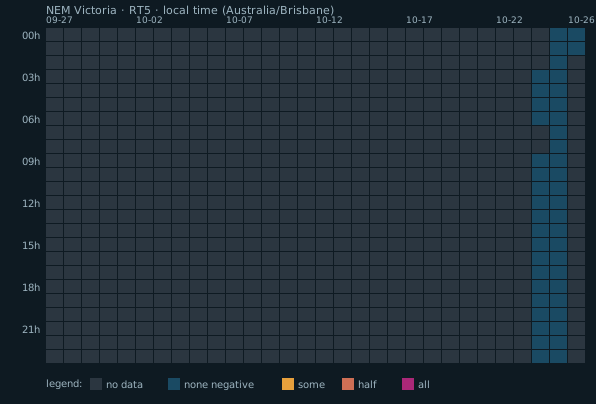
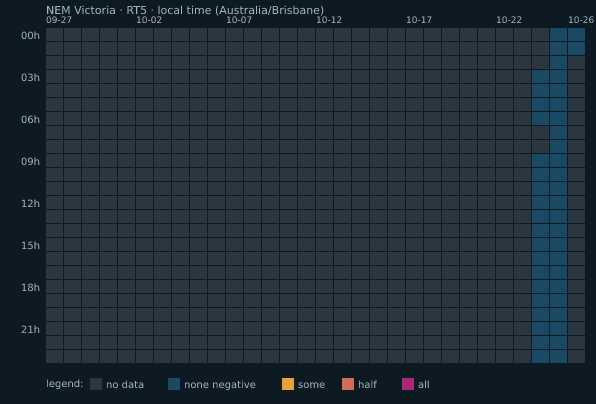
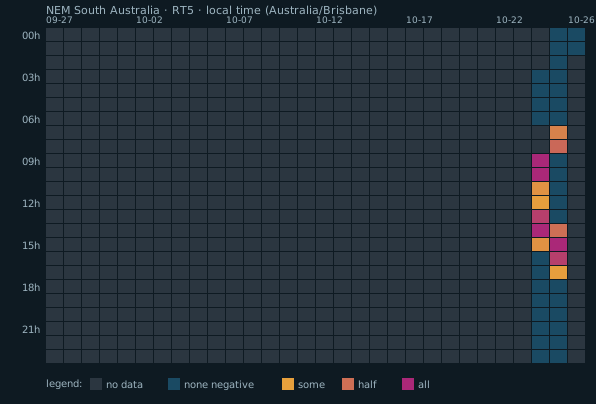
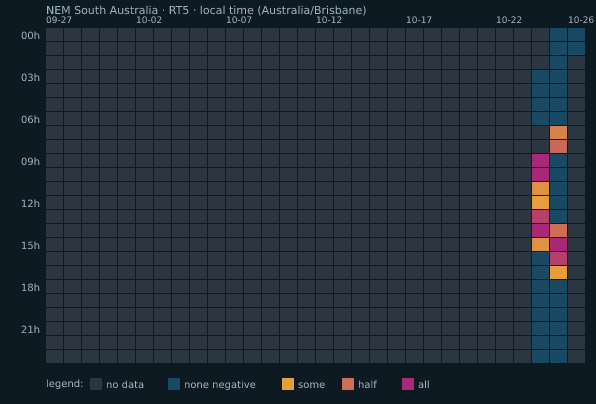
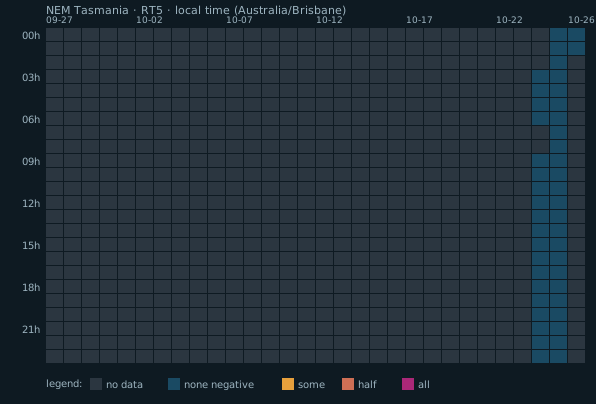
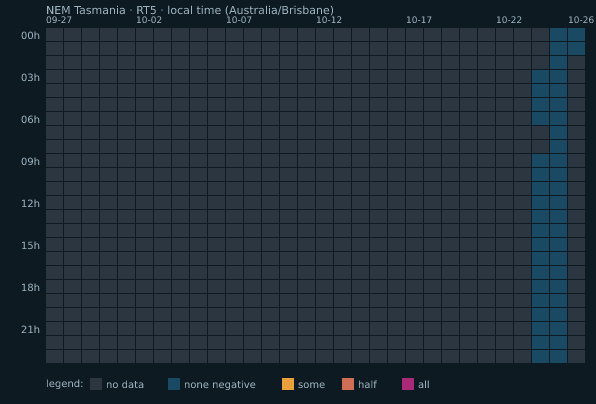
Each cell is one local hour of one day; colour shows the share of that hour's intervals with a price below zero (amber = few, purple = all). Grey cells have no data. Derived by SolarCostData from the published prices.
Sources & licences
Data: Source: Australian Energy Market Operator (AEMO), NEMWEB | Contains BMRS data © Elexon Limited copyright and database right 2026 | Source: Energinet (www.energidataservice.dk). source licence source licence Derived numbers and charts: CC BY 4.0, SolarCostData Data Desk (licence). Source data keeps its own licence.
Notional ledger
Notional: not cash received by consumers.
| Market | Notional value, year to date | In USD | Metered load in those intervals | Intervals used | Skipped (no load reading) |
|---|---|---|---|---|---|
| NEM New South Wales | 0D AUD | – | 0D MWh | 0 | 0 |
| NEM Queensland | 0D AUD | – | 0D MWh | 0 | 0 |
| NEM Victoria | 0D AUD | – | 0D MWh | 0 | 0 |
| NEM South Australia | 49442D AUD | ≈ 34720D USD ECB rate 2026-10-23 | 5721D MWh | 94 | 0 |
| NEM Tasmania | 0D AUD | – | 0D MWh | 0 | 0 |
Method: for every negative price interval since 1 January (local year) the absolute price is multiplied by the metered regional demand of the same interval in MWh (MW x interval length in hours) and summed. Notional: not cash received by consumers. It is an accounting illustration of how large the negative-priced volume was at wholesale prices; it ignores retail tariffs, contracts, hedges and generator payments, and no consumer receives this amount. Only markets that publish demand are listed.
Sources & licences
Data: Source: Australian Energy Market Operator (AEMO), NEMWEB | Contains BMRS data © Elexon Limited copyright and database right 2026 | Source: Energinet (www.energidataservice.dk). source licence source licence Derived numbers and charts: CC BY 4.0, SolarCostData Data Desk (licence). Source data keeps its own licence.
About negative prices
This page tracks wholesale electricity prices that fall below zero in the public markets covered by this site. A negative price means that, for one trading interval, sellers pay to put power into the grid and buyers are paid to take it. It is a signal of surplus supply at that moment, usually strong wind or sun meeting low demand, and it is not a price anyone pays on a household bill. The tables above are rebuilt every few minutes from the grid operators’ own published numbers.
For each market the table shows whether the price is negative now, how long the current unbroken run of negative intervals has lasted, the longest run in our data, the total hours of negative prices since 1 January, the median and lowest negative price, and the number of days since the last negative interval. Hours are counted interval by interval, so markets that publish 5-minute, 15-minute or 30-minute prices are measured on the same clock. Our data window starts on the date shown under each market name, and every total covers that window only.
The count of intervals close to a market floor appears only where the floor is a verified statutory limit. Elsewhere the page says that the floor is not verified, because showing a count against an unconfirmed limit would suggest precision we do not have. The notional ledger multiplies each negative price by the metered demand of the same interval. It is an illustration of scale at wholesale prices and is not money received by consumers.
The heat maps show hour of day against day for the last 30 days in local market time, and the feed lists every negative episode that lasted at least 15 minutes. For the general mechanics behind negative prices, read why prices go negative and the methodology.
RSS feed of negative-price episodes
Not for trading or operational decisions. Provisional data.