Great Britain electricity price today
Great Britain generated today
313,740MWhD
Metered to · ticking at the last metered rate
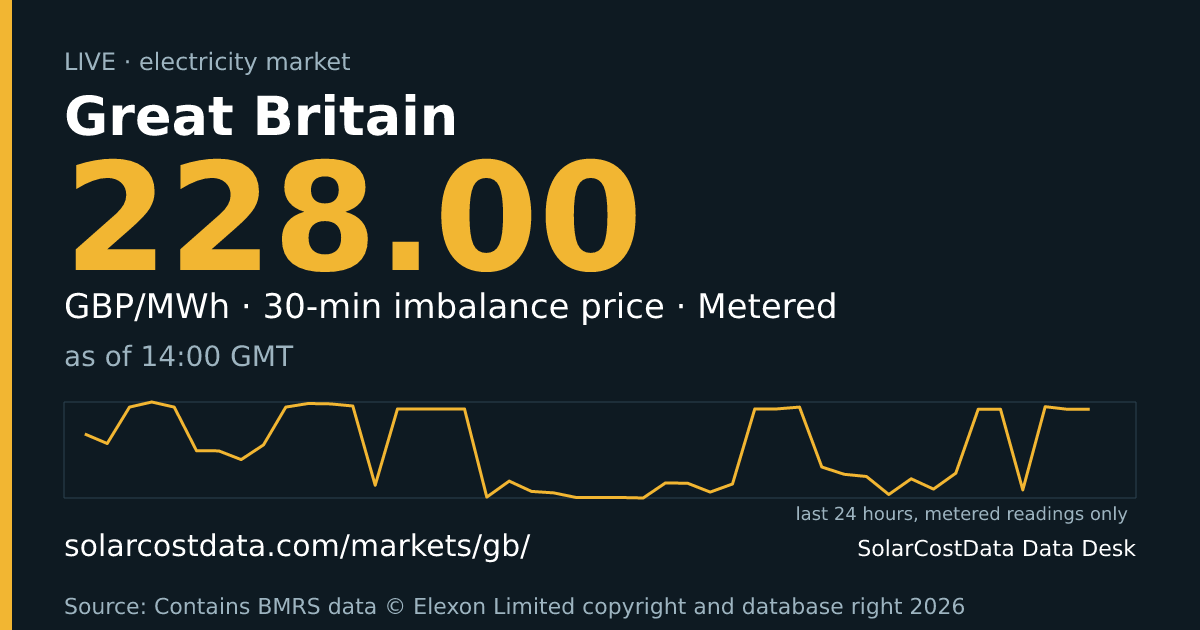
30-min imbalance price 228.00M GBP/MWh · IMB30
Now
30-min imbalance price
228.00M GBP/MWh
IMB30 ·
30-min market index price
95.67M GBP/MWh
RT30 ·
Generation (total)
21612D MW
Renewable share
59.7D %
Last 24 hours
Min -16.27, max 248.00, latest 228.00 GBP/MWh. Line breaks mark gaps longer than two reporting intervals.
Baseline building: 3 of 28 days.
Min -6.24, max 162.43, latest 95.67 GBP/MWh. Line breaks mark gaps longer than two reporting intervals.
Baseline building: 1 of 28 days.
Min 51.1, max 63.7, latest 59.7 %. Line breaks mark gaps longer than two reporting intervals.
Baseline building: 1 of 28 days.
Generation mix
| Source | Output | Share of generation |
|---|---|---|
| Wind | 11520M MW | 53.3D % |
| Imports | 7308M MW | – |
| Nuclear | 5061M MW | 23.4D % |
| Gas | 2563M MW | 11.9D % |
| Biomass | 899M MW | 4.2D % |
| Other | 708M MW | 3.3D % |
| Hydro | 480M MW | 2.2D % |
| Pumped storage | 381M MW | 1.8D % |
| Coal | 0M MW | 0.0D % |
| Oil | 0M MW | 0.0D % |
79 g/kWh over counted generation. Not counted: 708 MW of unknown fuel.
FUELINST covers transmission-connected generation only: embedded (distribution-connected) solar and most small wind are NOT included, so GB shows no solar figure and wind is understated relative to total output.
About this market
This page covers the Great Britain market: England, Scotland and Wales, balanced as a single zone. Our numbers come from Elexon, the company that administers settlement and publishes the BMRS data service. Generation is the FUELINST dataset, refreshed every five minutes. It reports only transmission-connected output, so rooftop and farm-scale solar and much of the smaller wind on distribution networks never appear. For that reason we publish no solar figure for Britain, and the wind line understates what the weather is really producing. Read the renewable share as a share of metered transmission output, not of national demand.
Two half-hourly prices are shown. The imbalance price is what parties pay or receive for being out of balance; since late 2015 there has been one price for both directions. The real-time price is the market index price from the APXMIDP provider, a traded-price signal for the same period. The two can diverge widely, because one reflects the system operator’s balancing actions and the other reflects trading. Prices are in pounds sterling; a dollar figure is a derived conversion and says so.
What moves the picture: wind output, gas as the usual marginal fuel, steady nuclear, and flows over interconnectors, including Viking Link to Denmark. Clock changes matter too. A normal settlement day has 48 periods, rising to 50 when the clocks go back in October, and every period is converted to UTC before we store it. Values are provisional and can be revised later.
Source
Source
Elexon BMRS (GB) · licence · Contains BMRS data © Elexon Limited copyright and database right 2026 · fetched ·
FUELINST covers transmission-connected generation only: embedded (distribution-connected) solar and most small wind are NOT included, so GB shows no solar figure and wind is understated relative to total output.
Clock-change days have 46 (March) or 50 (October) settlement periods; tested.
CO2 factors: IPCC AR5 WGIII Annex III lifecycle medians — table v1, 2026-10-23.
Facts
- Operator and data publisher: Elexon, through the BMRS / Insights Solution (keyless API).
- Generation dataset FUELINST covers transmission-connected plant only; embedded solar and most small wind are excluded.
- Since the P305 modification in November 2015, GB uses a single imbalance price, so the system sell and buy prices are equal. Source: Ofgem
- A normal settlement day has 48 half-hour periods, rising to 50 on the long clock-change day in October. Source: Elexon circular
- The real-time price series is the Market Index Data price from the APXMIDP provider; N2EXMIDP rows carry zero volume and are ignored.
- Viking Link, an interconnector between Bicker Fen (Lincolnshire) and Revsing (Jutland) with a design capacity of 1,400 MW, was put into operation on 29 December 2023. Source: Energinet
- Local time is Europe/London, which follows British Summer Time; all stored timestamps are UTC.
- Prices are in pounds sterling (GBP).
Other markets
Cite this
SolarCostData Data Desk (2026). Great Britain electricity data, solarcostdata.com/markets/gb/, accessed 2026-10-25. Source data: Contains BMRS data © Elexon Limited copyright and database right 2026.
Download last 24 h: data.csv · data.json (CC BY 4.0 (our figures); source data: Contains BMRS data © Elexon Limited copyright and database right 2026)
Not for trading or operational decisions. Provisional data.