New England electricity demand today
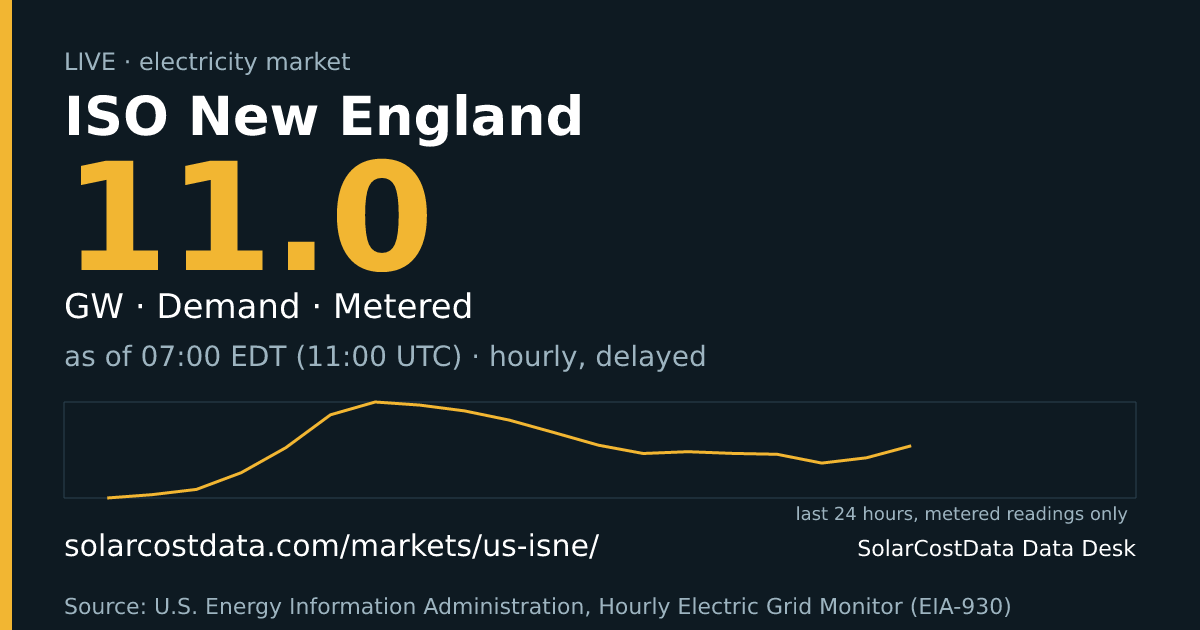
ISO New England used today
121,992MWhD
Metered to · hourly, delayed
Now
Demand
11022M MWhourly · EIA-930 preliminary · delayed
No price is shown for this market: the EIA-930 feed carries demand and generation, not prices.
Last 24 hours
Min 8472, max 13160, latest 11022 MW. Line breaks mark gaps longer than two reporting intervals.
Baseline building: 2 of 28 days.
Generation mix
This market publishes no generation mix.
About this market
ISO New England serves six states at the end of the country’s gas pipelines. Its story is gas. Natural gas supplied 55% of regional generation in 2025, and the region’s pipelines are shared with winter heating. Nuclear, oil and coal generators are critical on the coldest winter days when natural gas supply is constrained, so a cold snap can change the generation mix quickly.
Imports matter as well. Net flows over external ties met 7% of the region’s energy needs in 2025, mostly from New York and Canada. You can see these as net interchange.
Peak demand has historically come in summer, 28,130 MW on 2 August 2006, though ISO New England expects electrification of heating to make the system winter-peaking by the mid-2030s.
Wind is small but growing: regional wind capacity has risen 47% so far in 2026. Official ISO New England prices are published by ISO New England; we do not show prices on this page.
This page shows hourly demand, net generation, net interchange and generation by fuel where reported, from the EIA Hourly Electric Grid Monitor. Data are preliminary, revised later, delayed by an hour or two, and refreshed every three hours. Not for trading or operational decisions.
Source
Source
US EIA · licence · Source: U.S. Energy Information Administration, Hourly Electric Grid Monitor (EIA-930) · fetched ·
Source: U.S. Energy Information Administration, Hourly Electric Grid Monitor (EIA-930). Values are preliminary hourly averages (MWh per hour, shown as MW), published about one to two hours after the hour and refreshed every few hours; they can be revised.
Each value is shown as of the end of the hour it covers. If the feed is silent for more than 8 hours the figure is marked paused with its last value; nothing is estimated.
Facts
- New England has 7.6 million retail electricity customers and a population of 15.1 million (ISO New England). Source: ISO New England
- Total annual energy served was 117,744 GWh in 2025, against an all-time high of 136,355 GWh in 2005 (ISO New England). Source: ISO New England
- All-time summer peak demand is 28,130 MW (2 August 2006); the all-time winter peak is 22,818 MW (15 January 2004). Source: ISO New England
- In 2025, natural gas supplied 55% of generation in the region (60,447 of 111,643 GWh). Source: ISO New England
- Net flows over external ties were 7% of net energy for load in 2025: 4,349 GWh from New York, 2,806 GWh from Quebec and 992 GWh from New Brunswick. Source: ISO New England
- The region has 9,000 miles of high-voltage transmission lines (115 kV and above) and 14 interconnections to New York and Eastern Canada. Source: ISO New England
- About 400,000 distributed solar installations total about 7,500 MW, most of it behind the meter. Source: ISO New England
- Regional wind capacity rose 47% in 2026 to 2.5 GW after a 12% increase in 2025; wind generation in the first nine months of 2026 was 4,619 GWh (EIA). Source: EIA
Other markets
Demand in other markets
- Great Britain: 25140M MW
- Denmark: 5954D MW
- NEM New South Wales: 6547M MW
- NEM Queensland: 5836M MW
- NEM Victoria: 4530M MW
- NEM South Australia: 1245M MW
- NEM Tasmania: 878M MW
- Taiwan: 26238M MW
- ERCOT (Texas): 44674M MWhourly · EIA-930 preliminary · delayed
- PJM Interconnection: 78578M MWhourly · EIA-930 preliminary · delayed
- MISO: 61910M MWhourly · EIA-930 preliminary · delayed
- Southwest Power Pool (SPP): 26473M MWhourly · EIA-930 preliminary · delayed
Cite this
SolarCostData Data Desk (2026). ISO New England electricity data, solarcostdata.com/markets/us-isne/, accessed 2026-10-25. Source data: Source: U.S. Energy Information Administration, Hourly Electric Grid Monitor (EIA-930).
Download last 24 h: data.csv · data.json (CC BY 4.0 (our figures); source data: Source: U.S. Energy Information Administration, Hourly Electric Grid Monitor (EIA-930))
Not for trading or operational decisions. Provisional data.