8 to 42 Years: Solar Payback Period by State
- Fastest-payback states
- NY, ME, MA, RI, HI
- Slowest-payback states
- ND, SD, IA, LA, MS
- Biggest driver
- Electricity rate, not sun
- 2026 federal credit
- $0 (raises every number)
- Rate source
- U.S. EIA residential average
The end of the 30% federal credit didn’t change solar’s price — it changed its math. A system that effectively cost about $16,800 after the credit in 2025 now costs the full ~$24,000 in 2026, and that higher net number lands directly on your payback period. For a while, national “6-to-10-year payback” claims were roughly true. In 2026 they’re wrong almost everywhere, and how wrong depends entirely on which state you’re standing in.
Here’s the part most cost guides bury: your electricity rate matters far more than your sunshine. A kilowatt-hour offset in Hawaii (48.0¢) is worth three to four times one offset in Louisiana or Washington (12.7¢ and 14.7¢). That single fact reshuffles the whole ranking — and it’s why the cloudy Northeast pays back faster than the sunny Southwest.
Take the data with you
Writing about this, or checking our work? Good — that’s what the numbers are for.
Download the data: the full 50-state table — rate, production, cost, export regime, year-1 savings and payback — is one CSV: solar-payback-by-state-2026.csv . Licensed CC BY 4.0: use it anywhere, commercially or not, with attribution.
How these numbers are made
- Electricity rates: EIA Electric Power Monthly, Table 5.6.A — residential average by state (July 2026 data).
- Production: PVGIS v5.2 with the NSRDB radiation database, a five-point cluster per state, cut 10% for a real roof (shade, pitch, orientation).
- Installed cost: EnergySage marketplace quotes, August 2026, per state.
- One model: the CSV, this page and all 50 state pages are generated from the same code (
solarmodel.py), so they cannot disagree.- Last verified: August 30, 2026. Export credits reset on annual tariff cycles — treat every figure as a snapshot at that date.
Embed this chart: the 10 fastest and 10 slowest states, as a standalone image you can hotlink or copy. It’s built by the same script as the CSV.
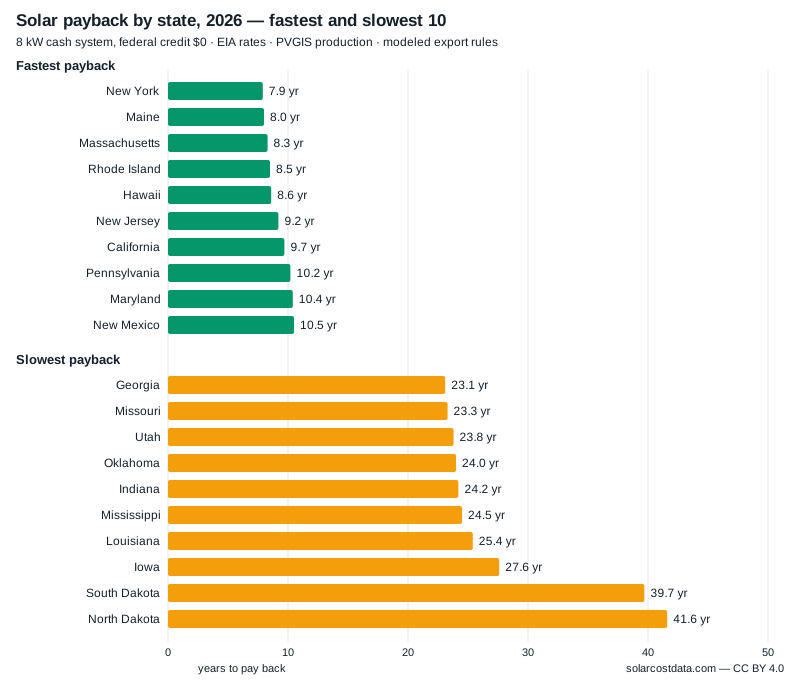
<img src="https://solarcostdata.com/img/charts/solar-payback-by-state-2026.svg"
     width="100%"
     alt="Solar payback by US state, 2026: 10 fastest and 10 slowest states, 8 kW system, no federal credit. Source: SolarCostData.com">
Cite this data: SolarCostData.com, Solar Payback by State (2026), https://solarcostdata.com/guides/solar-payback-by-state-2026/ — retrieved [date]. Underlying rates: EIA Table 5.6.A; production: PVGIS v5.2 (NSRDB); costs: EnergySage Aug 2026.
The map at a glance
Before the numbers, here’s the whole country at a glance — every state shaded by how fast solar pays off, greens fastest, reds slowest. Tap any state for its detail.
The full 2026 ranking: solar payback period by state
Shortest payback period first. Rates are EIA residential averages; payback assumes a typical 8 kW system at ~$3/W with the federal credit at $0 and roughly 90% of a rate-based bill offset. (How the formula itself works — and where simple payback misleads — is covered in the payback period explainer ; this page is the data.)
| # | State | Avg. rate | Est. 2026 payback* | Verdict (no federal credit) |
|---|---|---|---|---|
| 1 | New York | 29.9¢/kWh | 7.9 yrs | Still pays off |
| 2 | Maine | 32.41¢/kWh | 8.0 yrs | Still pays off |
| 3 | Massachusetts | 30.49¢/kWh | 8.3 yrs | Still pays off |
| 4 | Rhode Island | 28.29¢/kWh | 8.5 yrs | Still pays off |
| 5 | Hawaii | 48¢/kWh | 8.6 yrs | Still pays off |
| 6 | New Jersey | 25.19¢/kWh | 9.2 yrs | Still pays off |
| 7 | California | 33.61¢/kWh | 9.7 yrs | Still pays off |
| 8 | Pennsylvania | 21.72¢/kWh | 10.2 yrs | Still pays off |
| 9 | Maryland | 21.41¢/kWh | 10.4 yrs | Still pays off |
| 10 | New Mexico | 16.09¢/kWh | 10.5 yrs | Still pays off |
| 11 | Florida | 15.03¢/kWh | 10.6 yrs | Still pays off |
| 12 | Texas | 15.88¢/kWh | 10.7 yrs | Still pays off |
| 13 | Colorado | 17¢/kWh | 11.4 yrs | Still pays off |
| 14 | Delaware | 18.48¢/kWh | 11.7 yrs | Still pays off |
| 15 | Virginia | 17.55¢/kWh | 11.7 yrs | Still pays off |
| 16 | Wisconsin | 19.06¢/kWh | 14.8 yrs | Depends on incentives |
| 17 | Montana | 14.99¢/kWh | 15.2 yrs | Depends on incentives |
| 18 | Vermont | 23.75¢/kWh | 15.4 yrs | Depends on incentives |
| 19 | Oregon | 15.97¢/kWh | 16.4 yrs | Depends on incentives |
| 20 | Minnesota | 17.45¢/kWh | 16.6 yrs | Depends on incentives |
| 21 | Arizona | 15.38¢/kWh | 16.9 yrs | Depends on incentives |
| 22 | New Hampshire | 26.6¢/kWh | 17.1 yrs | Depends on incentives |
| 23 | Connecticut | 24.16¢/kWh | 17.6 yrs | Depends on incentives |
| 24 | Wyoming | 14.36¢/kWh | 18.1 yrs | Hard to justify on cash |
| 25 | Washington | 14.71¢/kWh | 18.5 yrs | Hard to justify on cash |
| 26 | Alabama | 16.4¢/kWh | 18.6 yrs | Hard to justify on cash |
| 27 | Michigan | 23.05¢/kWh | 19.7 yrs | Hard to justify on cash |
| 28 | West Virginia | 15.78¢/kWh | 20.6 yrs | Hard to justify on cash |
| 29 | Nevada | 12.77¢/kWh | 20.8 yrs | Hard to justify on cash |
| 30 | Nebraska | 13.78¢/kWh | 20.8 yrs | Hard to justify on cash |
| 31 | Tennessee | 13.71¢/kWh | 21.2 yrs | Hard to justify on cash |
| 32 | Ohio | 19.45¢/kWh | 21.3 yrs | Hard to justify on cash |
| 33 | North Carolina | 15.16¢/kWh | 21.4 yrs | Hard to justify on cash |
| 34 | Alaska | 28.83¢/kWh | 21.6 yrs | Hard to justify on cash |
| 35 | Kansas | 15.27¢/kWh | 22.1 yrs | Hard to justify on cash |
| 36 | Kentucky | 13.81¢/kWh | 22.6 yrs | Hard to justify on cash |
| 37 | South Carolina | 15.47¢/kWh | 22.6 yrs | Hard to justify on cash |
| 38 | Idaho | 13.73¢/kWh | 22.7 yrs | Hard to justify on cash |
| 39 | Arkansas | 14.33¢/kWh | 23.0 yrs | Hard to justify on cash |
| 40 | Illinois | 19.22¢/kWh | 23.0 yrs | Hard to justify on cash |
| 41 | Georgia | 16.27¢/kWh | 23.1 yrs | Hard to justify on cash |
| 42 | Missouri | 16.09¢/kWh | 23.3 yrs | Hard to justify on cash |
| 43 | Utah | 13.12¢/kWh | 23.8 yrs | Hard to justify on cash |
| 44 | Oklahoma | 14.35¢/kWh | 24.0 yrs | Hard to justify on cash |
| 45 | Indiana | 16.73¢/kWh | 24.2 yrs | Hard to justify on cash |
| 46 | Mississippi | 14.54¢/kWh | 24.5 yrs | Hard to justify on cash |
| 47 | Louisiana | 12.72¢/kWh | 25.4 yrs | Hard to justify on cash |
| 48 | Iowa | 15.99¢/kWh | 27.6 yrs | Hard to justify on cash |
| 49 | South Dakota | 15.37¢/kWh | 39.7 yrs | Hard to justify on cash |
| 50 | North Dakota | 13.41¢/kWh | 41.6 yrs | Hard to justify on cash |
*Estimates for comparison, not quotes. Net-metering terms, state incentives, roof quality and your actual usage all move the real figure — run yours in the 2026 savings calculator .
What the ranking actually tells you
Read down the list and a clear line appears around the 12-year mark. Above it sit the high-rate states — Hawaii in a league of its own, then the New England and Mid-Atlantic corridor plus California — where solar still breaks even well inside a panel’s 25-to-30-year life and then runs for over a decade of near-free power. Below the 18-year mark sit the cheap-power states, mostly across the South, the Plains and the Pacific Northwest, where a cash purchase struggles to pay for itself before the panels are middle-aged.
Sort those same states by their electricity rate instead of their payback, though, and the tidy pattern falls apart. If the rate were doing the work, the bars below would stretch out steadily as the rate drops. Instead they break in the middle — and the break lines up almost exactly with how each state credits your exports.
The states in the middle are the interesting ones. There, the federal credit’s absence is the difference between “clearly worth it” and “only if the incentives line up.” That’s exactly where a state tax credit (Arizona, New Mexico, South Carolina and a few others), an active SREC market (New Jersey, Massachusetts, Maryland), or strong net metering tips the decision — see the incentives-by-state comparison for which lever each state still pulls.
One caution about reading the rate column. A high rate is what puts a state near the top of this table, but it isn’t sufficient on its own — the export credit your utility pays for surplus power can quietly undo it. Connecticut and Massachusetts are both high-rate New England states, yet they finish about nine years apart on payback (17.6 vs. 8.3), because Massachusetts still credits exports at the retail rate while Connecticut has moved to net billing at roughly 7.2¢ against a 24.2¢ retail price. That case is worked through in why export rules beat electricity rates ; this page is the ranking, that post is the explanation for the rows that look wrong.
How long does it take for solar panels to pay for themselves?
Asked nationally, the honest answer is that there is no useful national number — the 2026 model spans a full factor of five. Four rows from the table, worked with the exact figures from their state pages, show what actually moves the payback period :
- New York — 7.9 years. An 8 kW system at ~$22,080, a 29.9¢/kWh rate, retail-rate export credits, and a state tax credit still in force. Every lever pulls the same direction; this is as good as 2026 cash math gets on the mainland.
- Connecticut — 17.6 years. The rate (24.2¢) on a $21,840 system says top-ten; the export regime says otherwise. Surplus power earns ~7.2¢, so every exported kWh loses about two-thirds of its value, and the payback more than doubles against neighbors a state line away.
- Iowa — 27.6 years. A 16.0¢ rate on a $26,240 system with ~4.8¢ export credits: the double squeeze of modest prices and weak export value that defines the bottom half of the table.
- North Dakota — 41.6 years. A 13.4¢ rate on a $33,440 system and ~3.4¢ exports put the breakeven past the panels’ own warranty. This is the row that makes “solar always pays for itself” a myth in 2026.
One more layer sits under the state averages: production and local pricing shift city by city, which is why the same model is run separately for metro pages like Albuquerque , Salt Lake City , Minneapolis , Detroit and Baltimore . If your city has a page, its number beats your state’s.
Where solar no longer pays back on cash
Being blunt about the losing cases is the whole point of an un-conflicted site. If you’re in a state paying roughly 11–13¢/kWh with weak net metering, a cash solar purchase in 2026 may not break even for 16–20 years — long enough that it competes with the panels’ own lifespan. That doesn’t automatically mean “no.” It means the cash route is the wrong one, and the honest alternatives are:
- a lease or PPA, where the installer still claims the commercial §48E credit and can pass part of it back as a lower rate;
- community solar , if you can’t make ownership pencil out — in a 25-plus-year state, a subscription discount can honestly beat buying;
- or simply waiting isn’t the fix — there’s no federal credit scheduled to return, so if the math doesn’t work today, it’s the structure that needs to change, not the timing.
What is the average payback period for solar panels?
The average is the wrong statistic to shop with, and this table is why. Whatever single number you compute, almost nobody lives at it: the top tier clusters at 8–9 years, the broad middle of the table runs from the low teens to about 18, and the cheap-power tail stretches from the mid-20s past 40. Quoting one national number to a homeowner in Hawaii and one in North Dakota misleads both of them in opposite directions. The honest procedure is: find your state’s row, then adjust for the three levers the average also hides — a state tax credit (Hawaii’s 35% and New York’s 25%, both capped at $5,000, are the strongest still running), an SREC market that pays ongoing certificate income, and your utility’s export regime, which the Connecticut example above shows can matter more than the rate itself. Current program terms live on DSIRE .
Sunniest ≠ best return
It’s worth saying plainly because so much marketing implies the opposite: the sunniest states are not the best places to buy solar in 2026. Arizona and Nevada bathe in sun but sell cheap electricity, so their payback lands in the slow half of the table. New England and New York get meaningfully less sun yet finish near the top, because a 30¢ rate does more for your payback than a couple of extra peak-sun hours ever could. When an installer leads with sunshine instead of your utility rate, they’re selling the wrong variable.
How we built this (and why you can trust the numbers)
No proprietary black box. Each state’s rate is the U.S. Energy Information Administration’s average residential price. We model one representative system — 8 kW at about $3 per watt gross — subtract the 2026 federal credit of $0, and divide that net cost by a year of bill savings, assuming panels offset roughly 90% of a rate-based bill. It’s deliberately simple so you can check it: higher rate → more annual savings → shorter payback.
What the model intentionally leaves out is what makes your number personal — your exact usage, your roof’s sun and pitch, your utility’s net-metering terms, and any state incentive. Layer those on with the savings calculator , then confirm your state’s specifics on cost by state and current programs on DSIRE . If a rate or rule shifts, this page gets rebuilt — the date at the top is the version you’re reading.
Sources
- Electricity rates — U.S. Energy Information Administration, average price by state .
- Installed cost — regional medians in the spirit of Lawrence Berkeley National Laboratory’s Tracking the Sun series; treat as orientation and compare against your own quotes.
- State and utility programs — DSIRE program index , Database of State Incentives for Renewables & Efficiency, NC Clean Energy Technology Center.
- Federal credit status — IRS, Residential Clean Energy Credit ; Public Law 119-21 (2025).
- Payback model — shared with our solar savings calculator : 2.5%/yr utility inflation, 0.5%/yr degradation, annual maintenance, one inverter replacement around year 14, and the 2026 federal credit at $0.
Figures on this page are estimates built from the sources above, not quotes. State and utility programs change and are often budget-limited — verify current terms on DSIRE and with your own utility before relying on them. Nothing here is tax, legal or financial advice.
Frequently asked questions
Which state has the best solar payback in 2026?
New York, at about 7.9 years on our model, with Maine a close second at 8.0. New York pairs a high rate with retail-rate export credits and a state tax credit; Maine’s rate is even higher and its exports also credit at full retail. Massachusetts, Rhode Island and Hawaii follow — Hawaii’s residential electricity is by far the most expensive in the country, but its net-billing export regime and higher system cost keep it in fifth instead of first.
In which states is solar not worth it in 2026?
In low-rate states — Louisiana, Nebraska, North Dakota, Idaho, Utah, Washington and much of the South and Plains — a cash purchase can take 16 years or longer to break even now that the federal credit is gone. Solar can still make sense there with a strong state incentive or a lease, but the plain cash math is hard to justify.
Why does the sunniest state not have the fastest payback?
Because payback is about money, not sunshine. Arizona and Nevada get more sun than New England, but their electricity is cheap, so each offset kWh saves less. A high electricity rate beats extra sun hours almost every time — which is why the Northeast and Hawaii top the payback ranking despite weaker sun.
How was this payback ranking calculated?
We take each state’s average residential electricity rate from the U.S. EIA, model a typical 8 kW system at about $3 per watt with the 2026 federal credit at $0, and divide the net cost by annual bill savings (roughly 90% offset of a rate-based bill). These are transparent estimates for comparison, not quotes — your roof, usage and net-metering terms move the real number.
Sources: U.S. Energy Information Administration (EIA) electricity rates · DSIRE incentive records · public IRS/OBBBA guidance. Figures are modeled estimates, not quotes or tax advice. See our methodology.
Where to go next
- Why Connecticut trails Massachusetts — Two high-rate states finish about nine years apart on payback. The export regime, not the rate, explains it.
- How payback is calculated — The formula behind every row of the table, plus where simple payback quietly misleads you.
- Cost by state — Your state’s own page: local prices, rates and the programs that survived.
- Incentives by state — In the middle of this table, a state credit or an SREC market is what tips the decision either way.
- 2026 savings calculator — The ranking models one representative system. This one models yours.