Electricity Rates by State (July 2026): All 50 Ranked
- Cheapest
- Louisiana — 12.72¢/kWh
- Most expensive
- Hawaii — 48.00¢/kWh
- US July-2026 total
- 18.31¢/kWh
- 2025 full-year average
- 17.0¢/kWh
- Source
- EIA EPM Table 5.6.A
- License
- CC BY 4.0 with attribution
Every rate below is the July 2026 average residential price from EIA Electric Power Monthly Table 5.6.A — the same single source every calculator and state page on this site uses, so nothing here can disagree with the rest of the site. Rates are statewide averages: your utility’s tariff is the number on your bill, and in deregulated states your contract sets it.
Download the data
- CSV, all 50 states: electricity-rates-by-state.csv — rate, rank, percent vs the US July-2026 average. CC BY 4.0: reuse freely with attribution to SolarCostData.com, underlying data credit to the EIA .
- Chart: highest and lowest ten, SVG — same license.
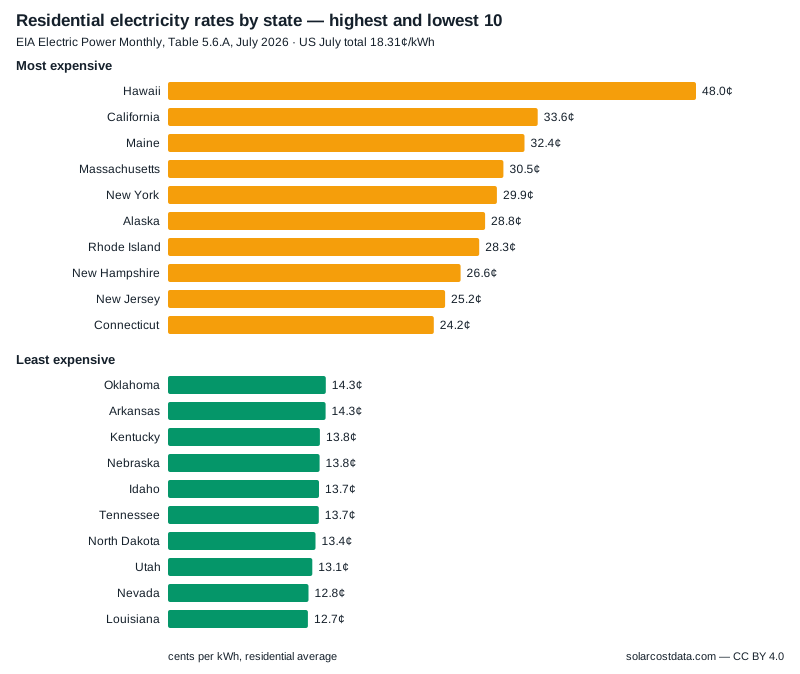
All 50 states, ranked
| # | State | July 2026 rate | vs US July total (18.31¢) |
|---|---|---|---|
| 1 | Hawaii | 48.00¢ | +162.2% |
| 2 | California | 33.61¢ | +83.6% |
| 3 | Maine | 32.41¢ | +77.0% |
| 4 | Massachusetts | 30.49¢ | +66.5% |
| 5 | New York | 29.90¢ | +63.3% |
| 6 | Alaska | 28.83¢ | +57.5% |
| 7 | Rhode Island | 28.29¢ | +54.5% |
| 8 | New Hampshire | 26.60¢ | +45.3% |
| 9 | New Jersey | 25.19¢ | +37.6% |
| 10 | Connecticut | 24.16¢ | +31.9% |
| 11 | Vermont | 23.75¢ | +29.7% |
| 12 | Michigan | 23.05¢ | +25.9% |
| 13 | Pennsylvania | 21.72¢ | +18.6% |
| 14 | Maryland | 21.41¢ | +16.9% |
| 15 | Ohio | 19.45¢ | +6.2% |
| 16 | Illinois | 19.22¢ | +5.0% |
| 17 | Wisconsin | 19.06¢ | +4.1% |
| 18 | Delaware | 18.48¢ | +0.9% |
| 19 | Virginia | 17.55¢ | -4.2% |
| 20 | Minnesota | 17.45¢ | -4.7% |
| 21 | Colorado | 17.00¢ | -7.2% |
| 22 | Indiana | 16.73¢ | -8.6% |
| 23 | Alabama | 16.40¢ | -10.4% |
| 24 | Georgia | 16.27¢ | -11.1% |
| 25 | Missouri | 16.09¢ | -12.1% |
| 26 | New Mexico | 16.09¢ | -12.1% |
| 27 | Iowa | 15.99¢ | -12.7% |
| 28 | Oregon | 15.97¢ | -12.8% |
| 29 | Texas | 15.88¢ | -13.3% |
| 30 | West Virginia | 15.78¢ | -13.8% |
| 31 | South Carolina | 15.47¢ | -15.5% |
| 32 | Arizona | 15.38¢ | -16.0% |
| 33 | South Dakota | 15.37¢ | -16.1% |
| 34 | Kansas | 15.27¢ | -16.6% |
| 35 | North Carolina | 15.16¢ | -17.2% |
| 36 | Florida | 15.03¢ | -17.9% |
| 37 | Montana | 14.99¢ | -18.1% |
| 38 | Washington | 14.71¢ | -19.7% |
| 39 | Mississippi | 14.54¢ | -20.6% |
| 40 | Wyoming | 14.36¢ | -21.6% |
| 41 | Oklahoma | 14.35¢ | -21.6% |
| 42 | Arkansas | 14.33¢ | -21.7% |
| 43 | Kentucky | 13.81¢ | -24.6% |
| 44 | Nebraska | 13.78¢ | -24.7% |
| 45 | Idaho | 13.73¢ | -25.0% |
| 46 | Tennessee | 13.71¢ | -25.1% |
| 47 | North Dakota | 13.41¢ | -26.8% |
| 48 | Utah | 13.12¢ | -28.3% |
| 49 | Nevada | 12.77¢ | -30.3% |
| 50 | Louisiana | 12.72¢ | -30.5% |
Reading the spread: the gap between the top and bottom of this table is larger than any efficiency decision a household can make — the same heat pump, EV or dryer costs 3.8× as much to run in Hawaii as in Louisiana. That is why every tool on this site asks for your state before it answers, and why the running-cost ranking and EV charging costs all quick-fill from this exact table.
Down to your own utility? The ZIP lookup maps your ZIP to its EIA-listed utilities and shows each one’s audited average price. Watching the trend rather than the snapshot? The 24-month rate tracker charts every state against the US average, month by month.
Method and vintage
The CSV is pure data (no comment rows); vintage and the CC BY 4.0 licence are in the README sidecar . Rates are read from the EIA’s published Table 5.6.A (July 2026 monthly edition) — not scraped, not modeled, and refreshed here when the EIA’s next Electric Power Monthly lands. The US full-year 2025 average was 17.0¢/kWh; the July 2026 monthly national figure is 18.3¢. Where this site quotes “the 17¢ US average” it means the labeled 2025 full-year figure. The methodology page covers every dataset behind the site.
Frequently asked questions
What is the average electricity rate in the US right now?
The July 2026 national residential average (US total) is 18.31¢/kWh (EIA Electric Power Monthly). The 2025 full-year average was 17.0¢ — the figure this site’s calculators use as their labeled default, because a full year smooths the summer peak that a single monthly number carries.
Which state has the cheapest electricity?
Louisiana, at 12.72¢/kWh in July 2026. Nevada (12.77¢) and Utah (13.12¢) are close behind. Cheap power cuts every bill on this site’s cost pages — and it is also why solar payback runs longest in exactly these states.
Which state has the most expensive electricity?
Hawaii, at 48.00¢/kWh — roughly 3.8 times the cheapest state. California (33.61¢) and Maine (32.41¢) follow. High rates make every appliance dearer to run and every kilowatt-hour of rooftop solar worth more.
Can I download this data?
Yes — the CSV below carries all 50 states with rate, rank and percent versus the US July-2026 average, licensed CC BY 4.0: free to reuse with attribution to SolarCostData.com and the EIA as the underlying source.
Sources: U.S. Energy Information Administration (EIA) electricity rates · DSIRE incentive records · public IRS/OBBBA guidance. Figures are modeled estimates, not quotes or tax advice. See our methodology.
Where these rates bite
- Cheapest and priciest electricity states — The editorial read of this table — what a 2¢ move actually does to a bill.
- Solar panel cost by state — The same 50 rates, turned into 2026 solar payback for an 8 kW system.
- Electricity cost calculator — Any appliance, your hours, your state’s rate from this table.
- Winter heating fuel comparison — How electricity at these rates stacks against gas, propane and oil per unit of heat.